Q4 2025 Y/Y Real Estate Market Analysis and Statistics
How is the real estate market? I’m asked that question almost every day and even though it’s a simple question, it’s a complicated one. Is the person asking a seller or a buyer – the market may feel different for each positions. Buyers are finding opportunity for negotiation that they didn’t have during the hectic COVID years. But many buyers are not springing into action when attractively priced properties hit and are surprised when properties go quickly.
Sellers still have a ton of equity from the past 6 years baked into their properties but the market is staying steady with more inventory and less buyers taking action. Negotiations are common. Reactions to negative news seems to be more swift – positive news is taking longer to have a measurable effect on the market.
Our market in the greater Bozeman, Belgrade, Livingston Big Sky and surrounding area has stayed resilient through 2025 in comparison to other areas of the nation, but we also have more normal inventory levels and properties are generally on the market for longer prior to gaining a buyer. This is a similar trend to many other mountain markets in the west. There remains uncertainty that can’t be solved by a small adjustment in interest rate or a single piece of good economic news.
Single Family
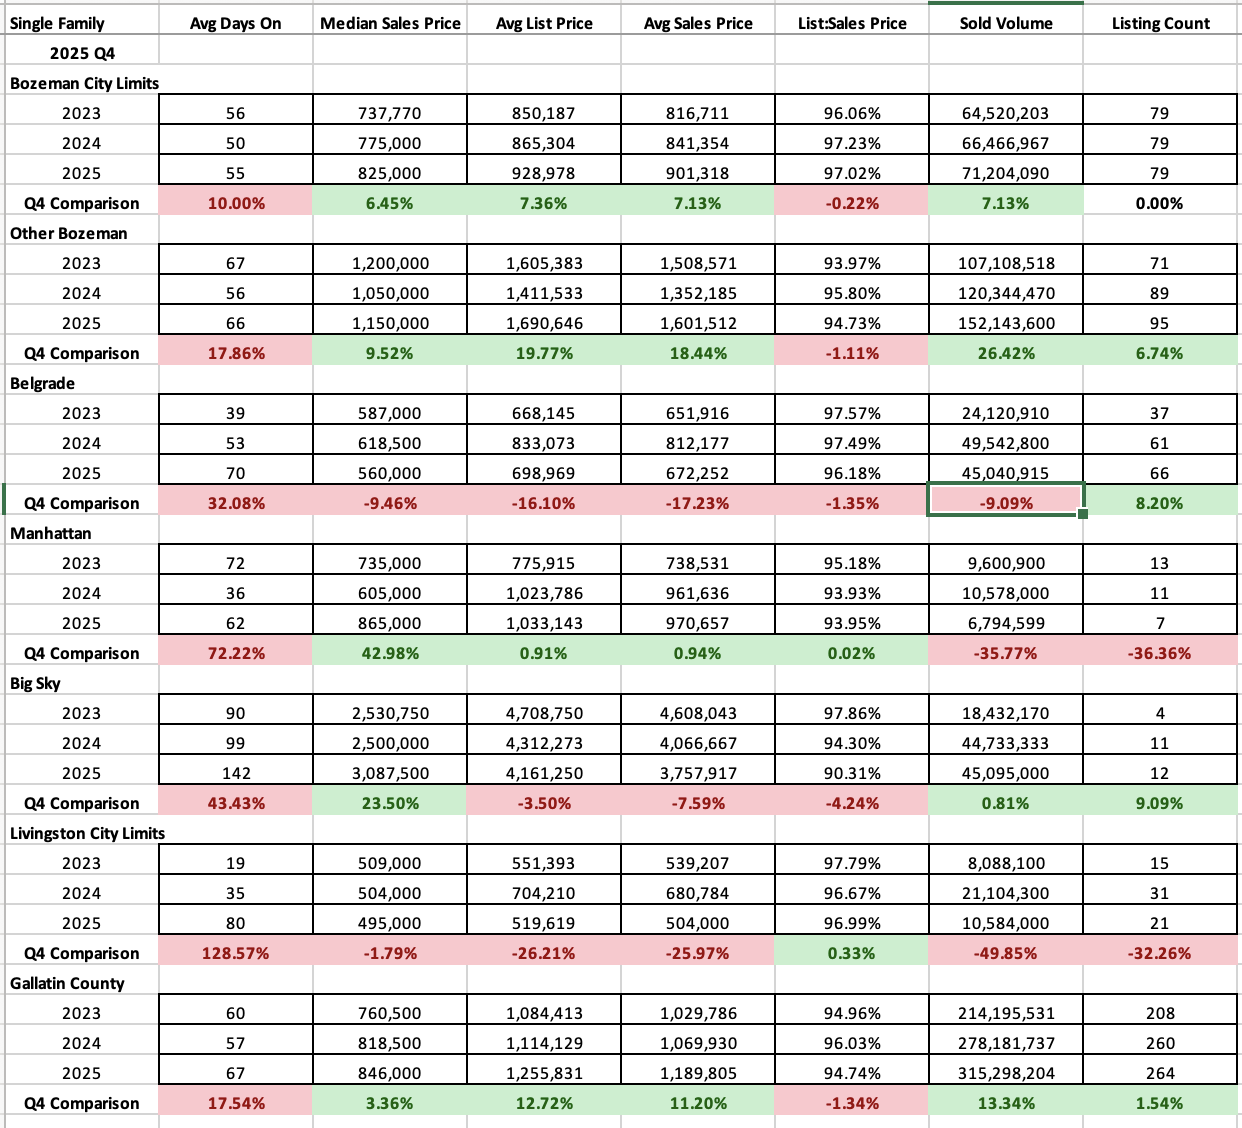
Single Family median sales prices for Q4 2025 have seen modest gains over 2024 in most areas that we track with a few areas showing some retraction. Median sales prices for City of Bozeman ($825K), greater Bozeman ($1.150M), Manhattan ($865K), Big Sky ($3.0875M) all saw an uptick in pricing – in all cases except greater Bozeman, higher than pricing in both 2023 and 2024. The areas that were flat or retracting slightly were Livingston ($495K) and Belgrade ($560K) which were both below both 2023 and 2024 median pricing for Q4.
Number of units sold were tied in City of Bozeman with both 2023 and 2024 at 79 units – a very weird coincidence. Greater Bozeman saw an uptick over 2023 and 2024 numbers to 95 units. Belgrade had an uptick over both 2023 and 2024 numbers to 66 units. Manhattan fell to 7 units. Big Sky saw 12 units sell – about even with 2024. Livingston was down by almost 30 percent from Q4 2024 sales but still above 2023 numbers.
List to sales price ratios show there is significant negotiations happening on all properties in all areas. Indicative of a stable, trending towards buyers’ market – the median prices continue to climb meaning sellers are still pushing list prices higher than buyers are willing to pay. City of Bozeman saw around 3% price reduction prior to properties being offered on and then an additional 3% reduction was typical. Greater Bozeman saw around a 4% price reduction prior to properties going pending with another 3% price reduction with an offer. Belgrade saw around a 3% price reduction prior to properties going pending with another 4% price reduction with an offer. Big Sky saw around a 2% price reduction prior to properties going pending with another 10% price reduction with an offer. Manhattan saw around a 2% price reduction prior to properties going pending with another 4% price reduction with an offer. Livingston saw around a 4% price reduction prior to properties going pending with another 2% price reduction with an offer.
Average days on market for City of Bozeman were about the same as 2023 and 2024 as just under 2 months. Average days on market for Greater Bozeman were up to just over 2 months, for Belgrade were up another month to just over 2 months, for Manhattan were up another month to 2 months on average, for Big Sky were up an additional 2 months to 5 months on average and Livingston was up another month+ to almost 3 months on average.
Condo/Townhome
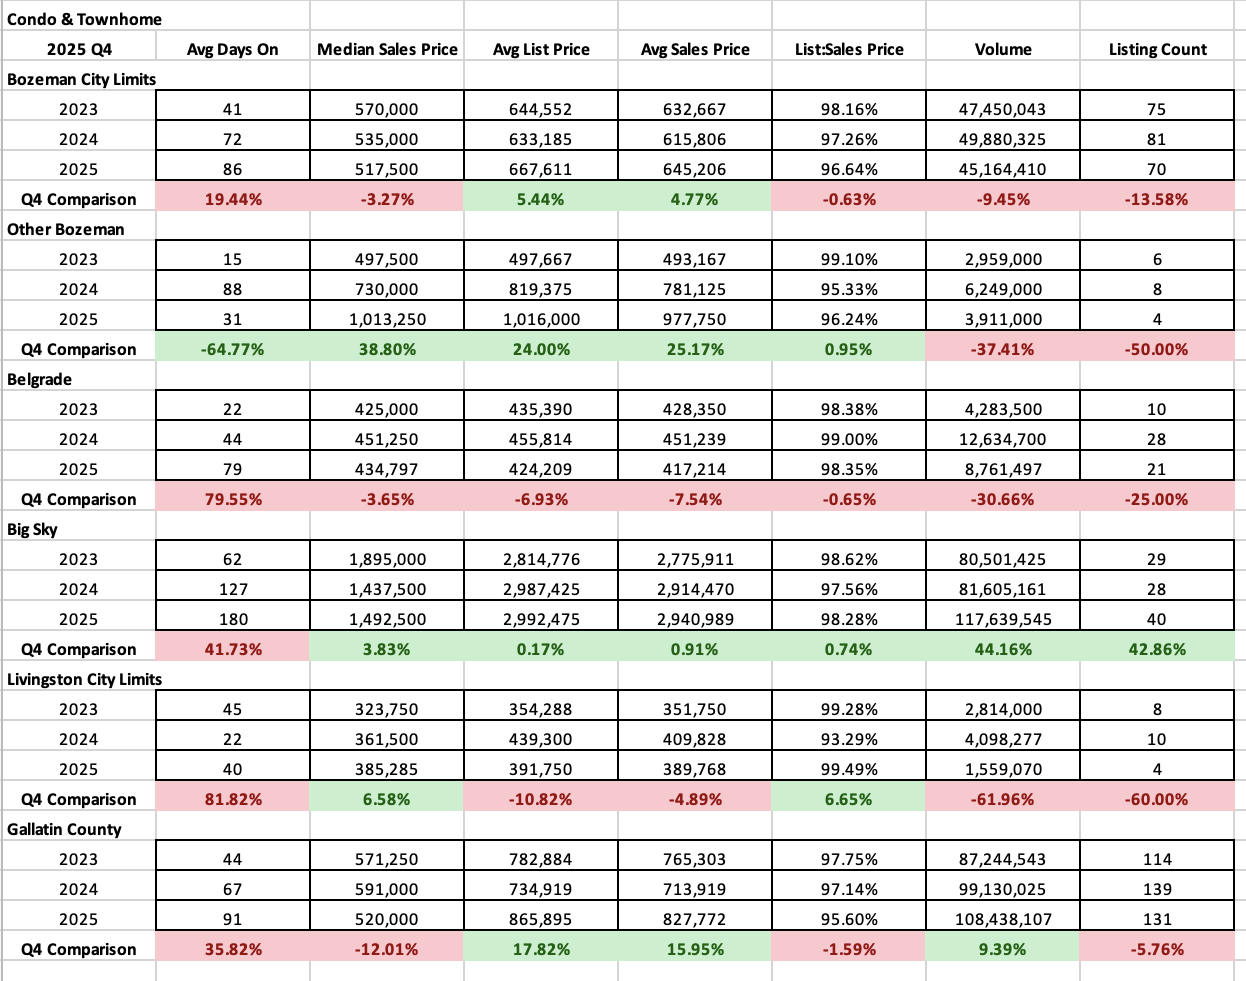
Condo and Townhome median sales prices were a mixed bag, in most places staying fairly static with a more drastic increase in greater Bozeman (due to less sales and higher priced properties). Condos and townhomes have been experiencing more of a flat market with little to no appreciation. Median sales for Bozeman were flat at $517K, for outside Bozeman were up but with little sales it’s a data anomaly, for Belgrade were flat at $434K, for Big Sky were flat at $1.492M and for Livingston were upticked slightly at $385K.
Number units sold dropped in almost all areas with the exception of Big Sky where there were condos in the construction pipeline. Bozeman was down by 14% Q4 2024 to Q4 2025, outside Bozeman was down 50%, Belgrade was down 25% and Livingston was down 60%.
List to sales price ratios show discounting happening across the board but not as much as single family homes. Sellers are holding tight on pricing while buyers whittle slightly away at prices in negotiations – averages of around 1-3% were common across the board.
Average days on market grew in all areas but outside of Bozeman. Typical days on market for City of Bozeman is now 3 months, for Belgrade is 3 months, for Big Sky is 6 months, for Livingston is 1.5 months.
Land
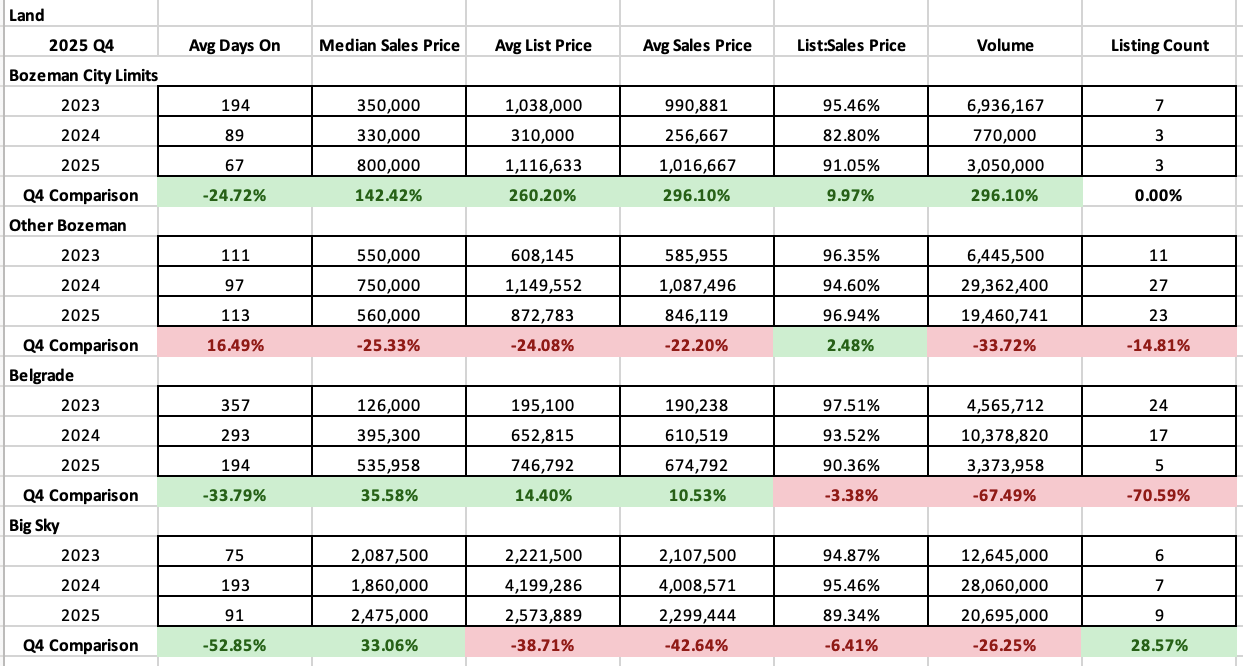
Land has seen steady or less volume than previous years. Median sales prices have jumped where there has been sales – indicating only premium lots are selling. Median prices are now $800K in City of Bozeman, $560K in greater Bozeman, $535K in Belgrade and $2.475M in Big Sky.
Number of parcels sold are anemic – with only 3 in City of Bozeman, 23 in greater Bozeman, 5 in Belgrade and 9 in Big Sky in Q4 2025.
List to sales price ratios show discounting of 3% prior to discounting on offer of 11% on average in City of Bozeman. For greater Bozeman there was less discounting with an average of 3% taken off original list price for sales price. In Belgrade properties were typically discounted 7% off original list price.
Average days on market have dropped in almost all areas – down almost a month in City of Bozeman, down to 6 months in Belgrade and down to 3 months in Big Sky. Greater Bozeman saw an uptick to almost 4 months on average.