
We’re now halfway through 2026 and time is flying. Our market in the greater Bozeman, Belgrade, Livingston Big Sky and surrounding area has stayed resilient in comparison to other areas of the nation, but we also have building inventory and consumer sentiment overall has suffered due to uncertainty. Sales are happening – the market is moving faster than in 2025 – but the appreciation that our area grew accustomed to for about a decade (before the pandemic and during) has flattened. With inflationary pressures, we likely are also experiencing a quiet and small correction that is not ‘visible’ – if money is worth less, a property valued similarly without appreciation has dropped in value. The market feels balanced – negotiation is happening - I’m finding that many buyers are now understanding that it is unlikely that rates will go down (nor should they at this time and they’re moving forward on purchases. And many sellers are finally ready to move on, the market is ripe for sellers cashing in and having the ability to take their time searching for and negotiating on a replacement property.
Single Family
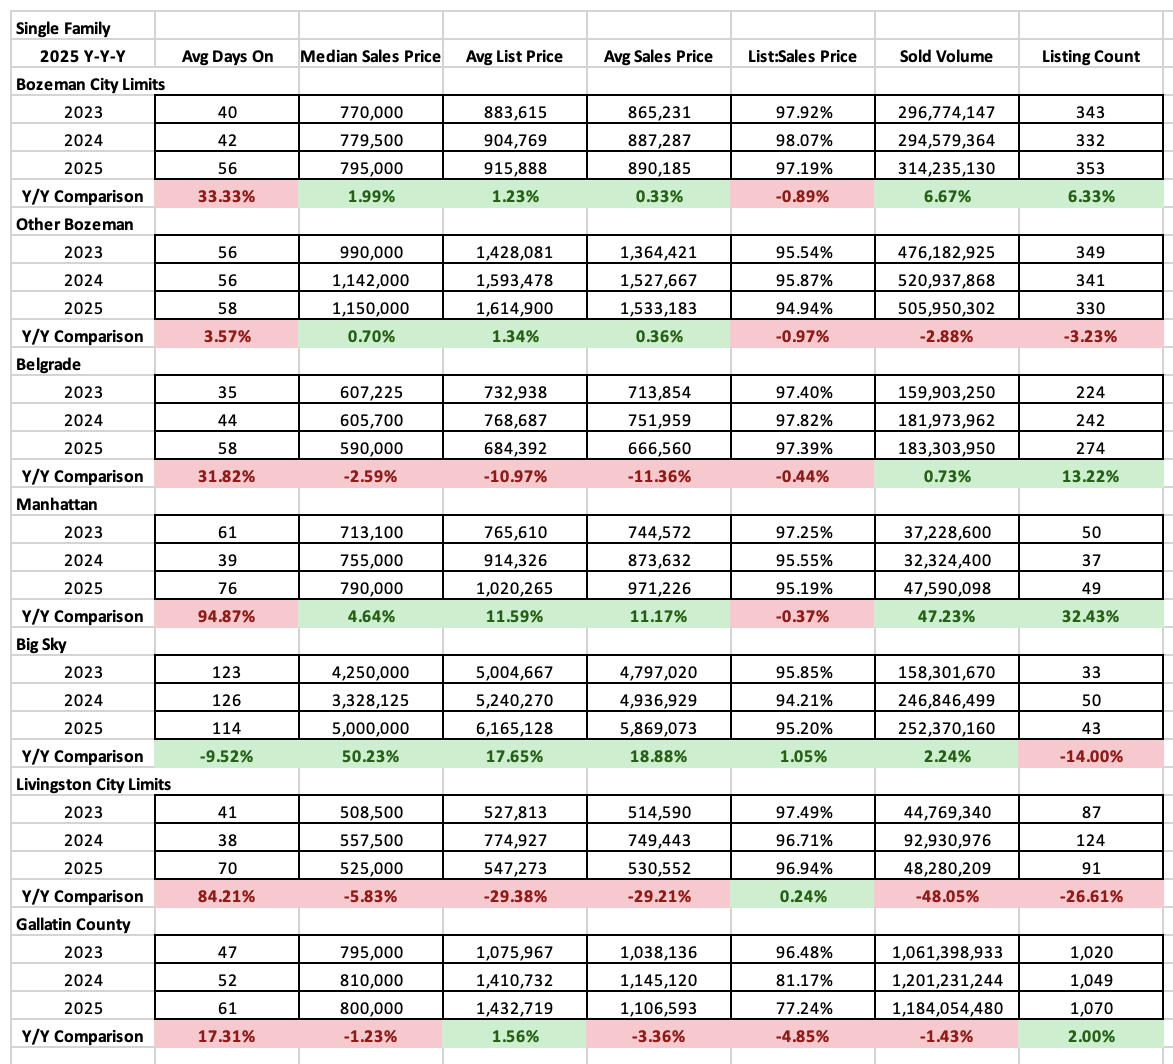
Single family median sales prices for Q2 2026 stayed relatively stable, with some downward movement in Big Sky. Median sales prices for City of Bozeman ($758K). Greater Bozeman ($1.194M), Belgrade ($582K) and Manhattan ($709K) were similar to 2025. Median sales prices for Livingston were down ($473K) and median sales prices for Big Sky ($2.4M) dropped significantly year over year as new construction pipeline sales have dropped off.
Number of units sold are similar in City of Bozeman, Greater Bozeman, Belgrade, and Big Sky. Manhattan and Livingston saw an uptick in closed sales over 2025.
List to sales price ratios show that negotiation is still occurring across the board – typically properties are undergoing a 3-4% price adjustment on offer depending on area. That has improved slightly from the year prior. Discounting was at 3% on average in the city of Bozeman, 4% greater Bozeman, 5% Belgrade, 2% Big Sky, 5.5% Manhattan and 3.5% Livingston.
Average days on market (marking days prior to going pending) for sold properties have increased in Greater Bozeman (2 months), Belgrade (2 months), Manhattan (2 months), and Big Sky (6 months). Days on market are steady for Livingston (1 month) and City of Bozeman (2 months).
Condo/Townhome
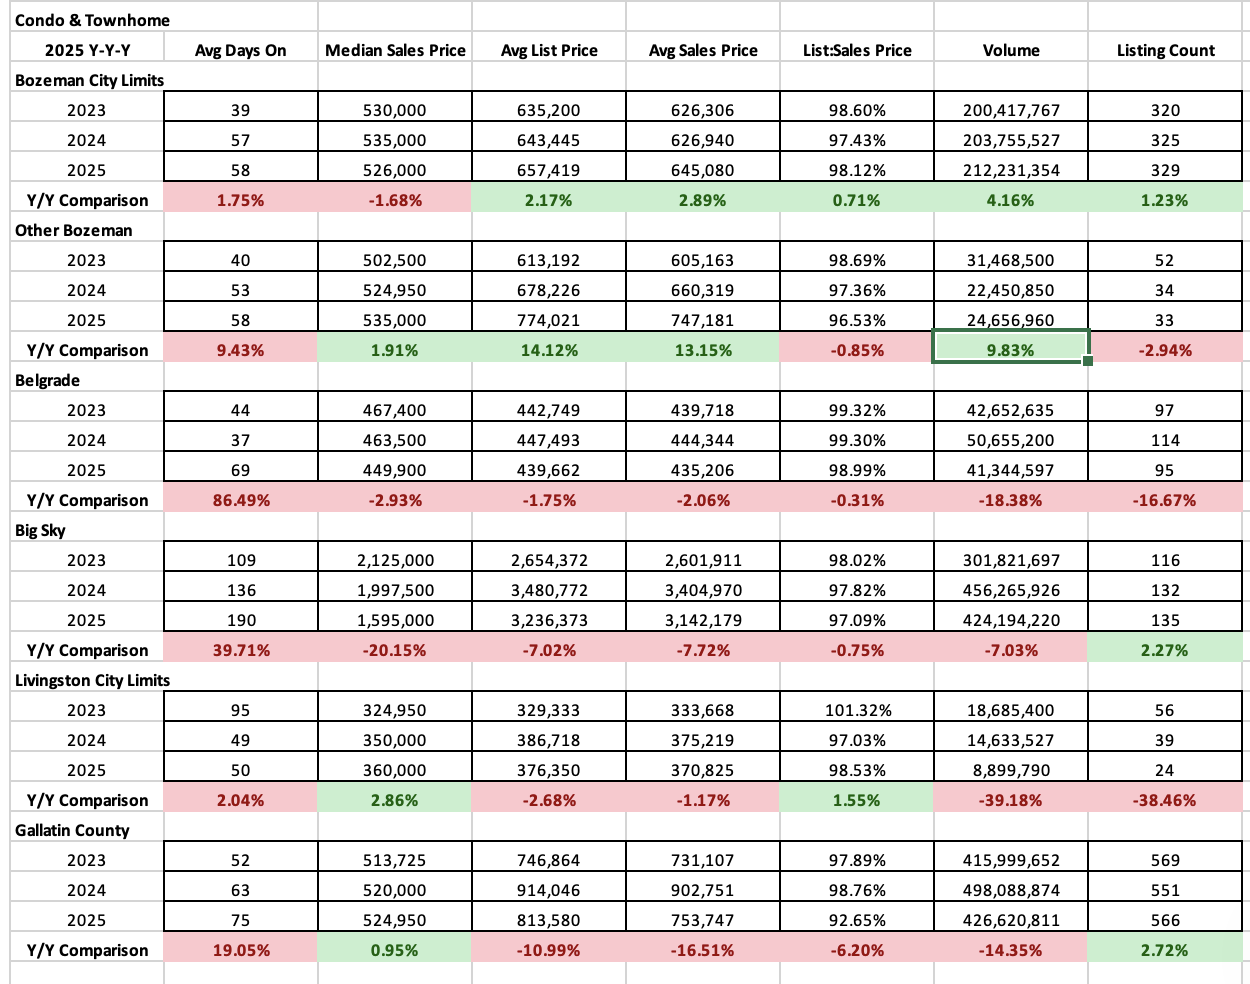
Condo and Townhome median sales prices for Q2 2026 have stayed steady year over year in most areas and have increased in others. Median sales prices for City of Bozeman ($495K), Belgrade ($449K), Livingston ($365K) were all steady. Greater Bozeman saw a rise to $607K and Big Sky was more similar to 2024 in pricing at $1.650M.
Number of units sold were steady to pointing upwards in all areas with a slight uptick in City of Bozeman and greater Bozeman year over year.
List to sales ratios show more modest discounting as compared with single family homes, with between 1.5-3% on average. City of Bozeman (3%), Greater Bozeman (2.5%), Belgrade (1.25%), Big Sky (2.75%) and Livingston (1.3%) were all within parameters of normal negotiation.
Average days on market have been more volatile. City of Bozeman went up to just over 2.5 months, greater Bozeman dropped to under 2 months, Belgrade stayed flat at just over 2 months. Big Sky dropped to 3 months on average and Livingston increased to just over 3 months on average.
Land
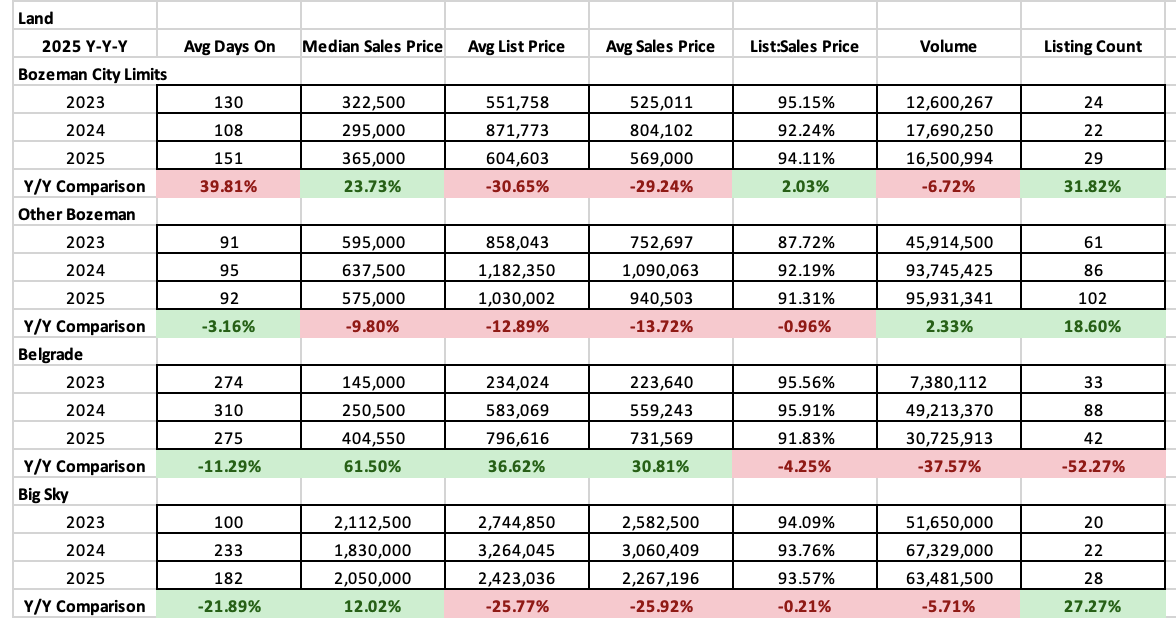
Land sales continue to be rather anemic but are similar to 2025. Median sales prices for Bozeman ($260K) and Greater Bozeman ($575K) were static. Belgrade ($530K) and Big Sky ($1.4M) saw notable increases year over year.
Number of units sold were similar or slightly up from the previous year. City of Bozeman had the most increase – up to 11 properties for the quarter. 39 properties sold in greater Bozeman, 6 properties in Belgrade and 11 properties in Big Sky.
List to sales price ratios show negotiation is still occurring – in greater amounts than built product. Discounts of 4-10% on average were seen across the area, City of Bozeman saw 10% discounting on average, greater Bozeman saw 4%, Belgrade saw 6.25% and Big Sky saw 7.5%.
Average days on market were similar down in all areas which is a nice change from the pattern. 6 months on average for City of Bozeman, 3 months on average for greater Bozeman, 4 months on average for Belgrade and 6 months on average for Big Sky.
High End and Luxury
Luxury | High End Single Family
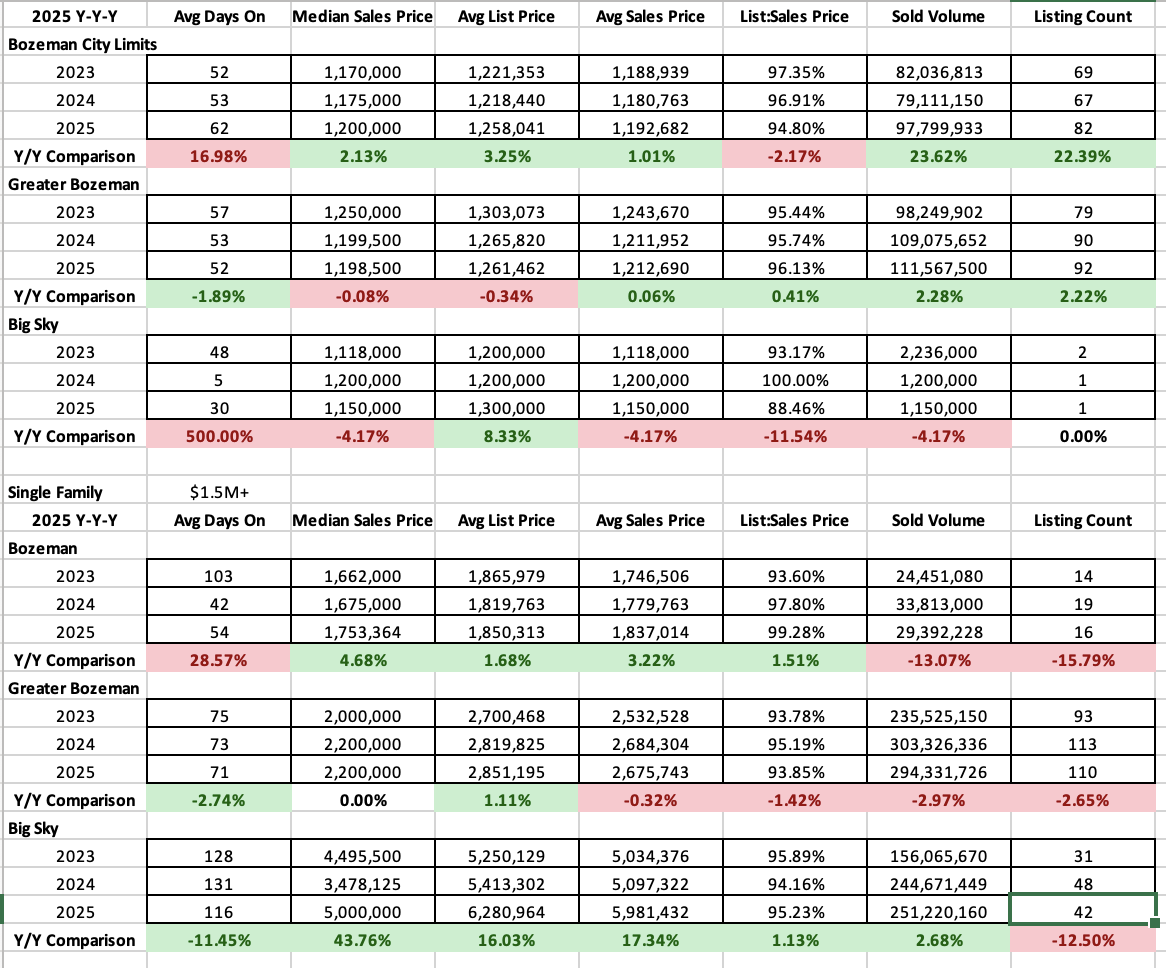
For high-end single-family home number of sold listings in Q2 2026 vs Q2 2025 (those $1M-$1.5M in closed price) in the two areas tracked (City of Bozeman, greater Bozeman), number of listings sold were slightly below 2025 levels and 2024 levels. Average days on market were down – in Bozeman to one month and greater Bozeman to one month – suggesting that well positioned properties are moving while others lag. List to sales price ratios indicate modest negotiation – with 2.7-2.9% discounting off list price to sold price.
Luxury single family home number of sold listings (those $1.5M and higher in closed price) in the three areas tracked (City of Bozeman, greater Bozeman and Big Sky) showed number of listings sold matched more closely with 2024 – a higher volume year. In fact, more volume sold in Q2 than in 2025 or 2024 in City of Bozeman and greater Bozeman. Big Sky was off as a surge of new construction ultra luxury listings have sold and moved out of the pipeline. List to sales price ratios show 4.7-6% discounting on average between list to sales prices for these areas.
Luxury | High End Condo/Townhome
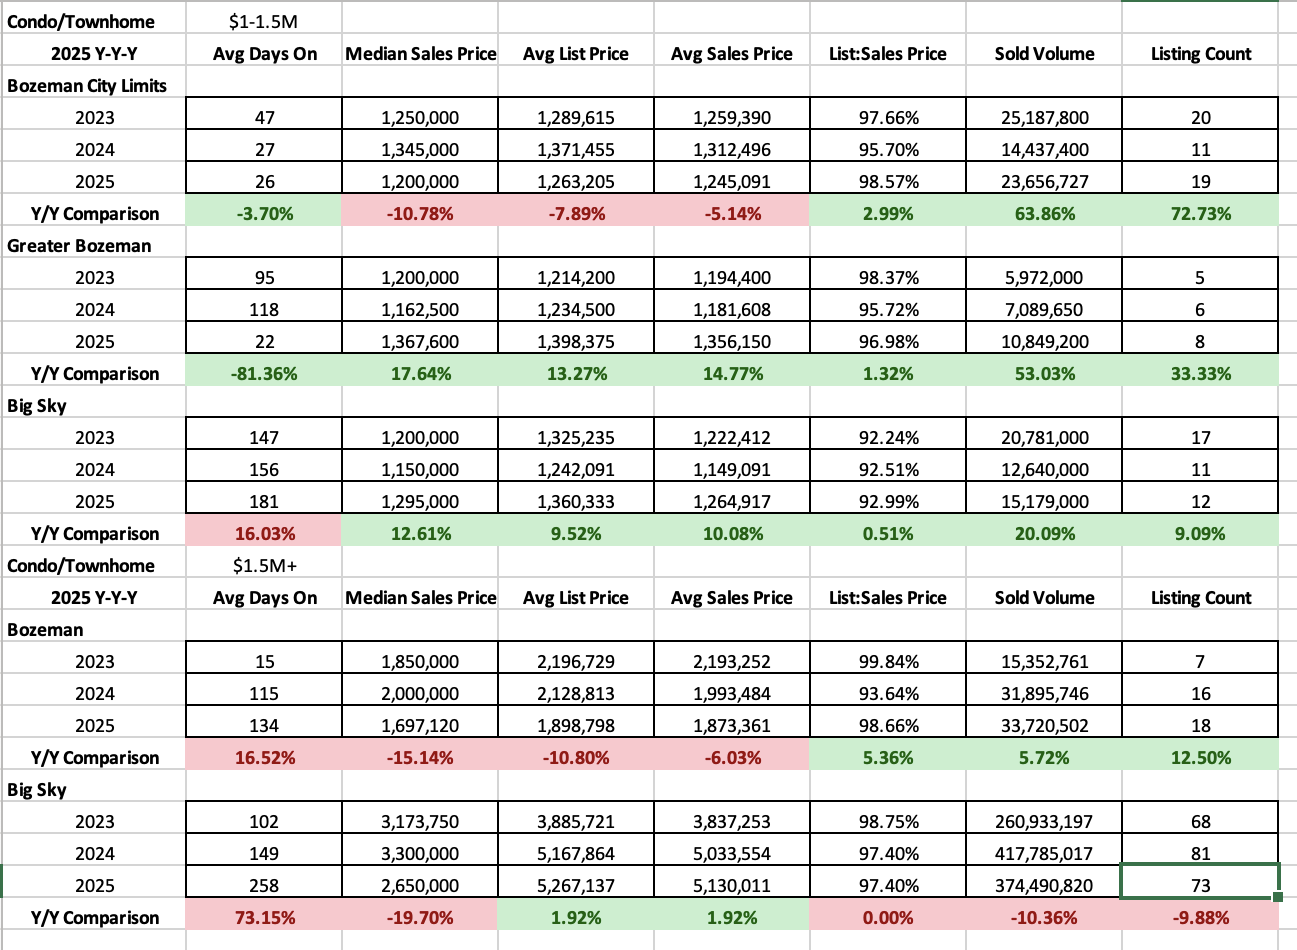
High-end condo and townhome number of sold listings (those $1M-$1.5M in closed price) in the three areas tracked (City of Bozeman, greater Bozeman and Big Sky) showed number of properties sold were higher than in 2025 for all areas. Average days on market were similar in City of Bozeman (1 month), far below 2025 in Greater Bozeman to just under one month and around 6 months for Big Sky. List to sales price ratios show discounting in City of Bozeman of 1.5% off list price, 3% for greater Bozeman and 7% for Big Sky.
Luxury condo and townhome number of sold listings (those $1.5M and higher in closed price) for City of Bozeman and Big Sky saw similar number of listings sold – Big Sky saw 73 properties and City of Bozeman saw 18. Average days on market were up in both areas, close to 4.5 months for City of Bozeman and 8 months for City of Bozeman. List to sales price ratios show discounting in City of Bozeman of 1.5% off list price